Interactive mapping with RShiny
In this workshop, we learned how to use R to read in spatial data and make beautiful interactive online maps. # A journey in maps and apps…
- The basics of programming for interactivity: Reactivity
- R package options for mapping interactively in R, with pros and cons
- Make an interactive map and share in a web app
To follow along in R you will need several packages that can be installed with a single line of code:
install.packages(c('shiny', 'leaflet', 'sf', 'tmap', 'dplyr'))Note: This journey is thanks to the awesome book Mastering Shiny
Why interactive and why Shiny?
Open Science
- Interactive web apps are a great way to make our research open, transparent, and engaging
- Move beyond static papers
Shiny
- Performative apps without HTML, javascript, CSS…
- Range of users - academics to tech companies
- Need to be hosted on a web server
Server options
- shinyapps.io: free or subscription options
- See here for more info on Rshiny servers
- There are other ‘non-R’ server options out there too
App fundamentals
Interactivity requires Reactivity
What is reactive programming?
Outputs react to inputs
- Means computations are only done when necessary (moving beyond functions to reactions)
- Reactive contexts are lazy and cached
It’s different from how we normally code our scripts:
- Commands vs. recipes
- Imperative vs. declarative
- Assertive vs. passive-aggressive
Shiny
{shiny} provides a framework for reactive programming:
- User-interface (ui): how it looks. Takes inputs and displays outputs
- Server: has the recipe to turn inputs into outputs
hint: if you have {shiny} installed, just type shinyapp in your R script to insert boilerplate shiny app code and get started quickly
library(shiny)
ui <- fluidPage(

)
server <- function(input, output, session) {

}
shinyApp(ui, server)
A simple histogram
hist(rnorm(25))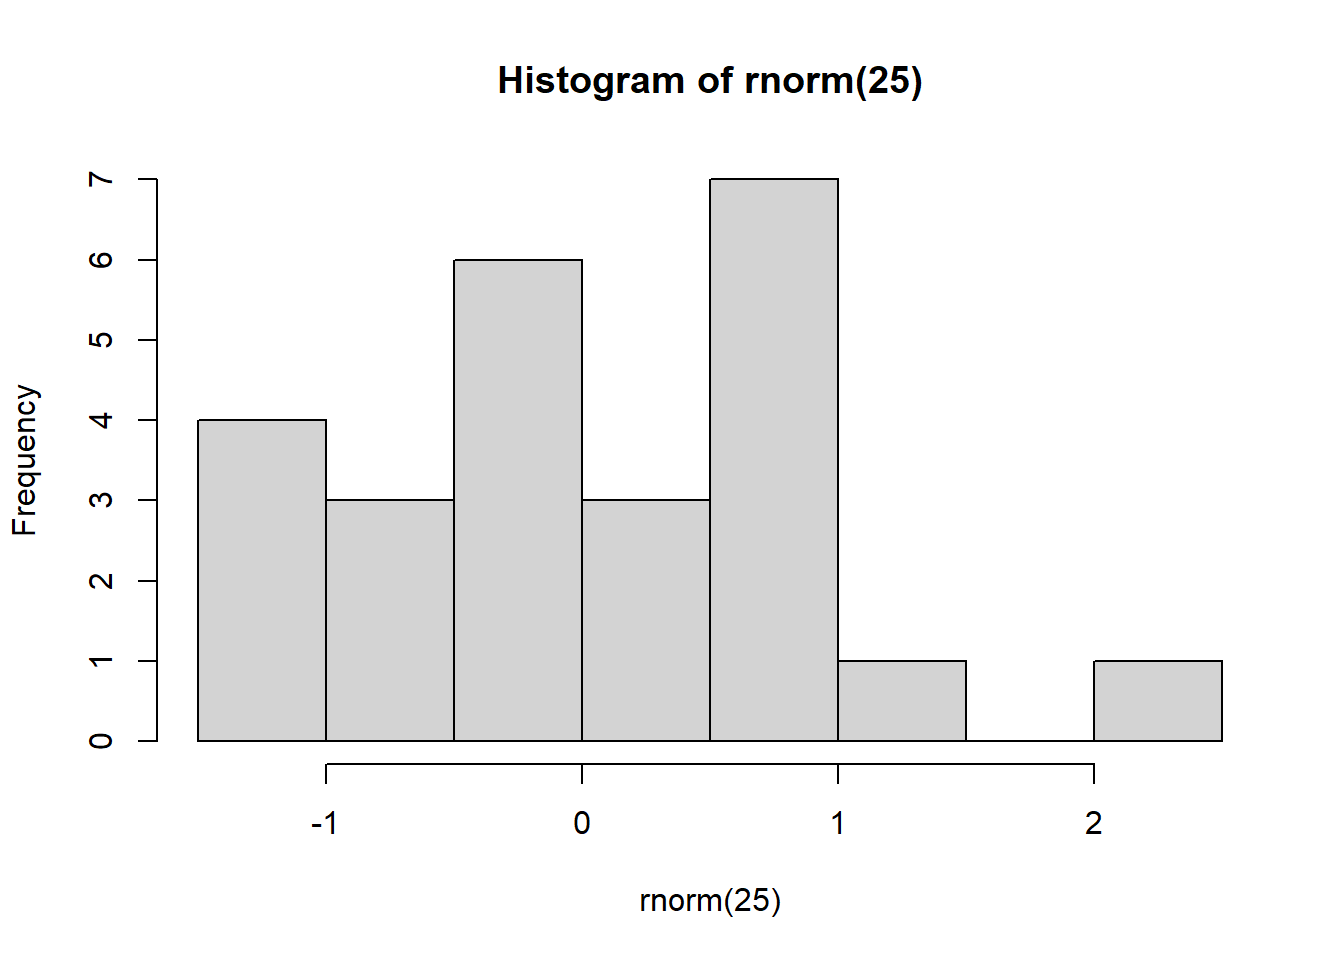
A reactive histogram
library(shiny)
ui <- fluidPage(
  numericInput(inputId = "n", "Sample size", value = 25),
  plotOutput(outputId = "hist")
)
server <- function(input, output, session) {
  output$hist <- renderPlot({
    hist(rnorm(input$n))
    })
}
shinyApp(ui, server)
You’ll need to hit the ‘Run app’ button in the top right corner of your script.
Note There’s an additional reactive tool, reactive expressions. Reactive expressions can be used to eliminate redundant code in your app, thereby improving efficiency. Find more information here.
But what about maps?
My go-to for mapping in R these days is {tmap}
One of the reasons is that I can make either interactive or static, publication-quality maps with ease. Just set the ‘mode’.
library(tmap)
data('World')
tmap_mode('view')
## tmap mode set to interactive viewingqtm(World, 'name') # qtm stands for 'quick thematic mapper'Add some reactivity
Let’s add a widget to allow users to choose their country from a list
library(shiny)
library(tmap)
library(dplyr)
data('World')
ui <- fluidPage(
  tmapOutput('map'),
  selectInput('var', 'Select country',
              choices = c('Global', as.character(World$name)),
              selected = 'Global')
)
server <- function(input, output, session) {
  output$map <- renderTmap({
    if(input$var == 'Global'){
      qtm(World, 'name')
    }else{
      qtm(filter(World, name == input$var))
    }
  })
}
shinyApp(ui, server)
Don’t forget to hit the ‘Run app’ button in the top right corner of your script
Customising and scaling your interactive map
If you want to customise your map with more features, the leaflet R package offers some nice functionality (there are others too)
{tmap} and {leaflet} both use ‘scalable vector graphics’ (SVG) to visualise maps on the web
- This is fine for simple apps, but if you need to render large datasets or do complex computations they will be really slow
Scaling-up your map app might require graphics to be rendered in ‘WebGL’ instead of SVG
- There are several R packages to try including mapdeck and rdeck
- These usually require API tokens to access basemaps from mapbox
Should I go SVG or WebGL?
- Generally I’ve found there is a feature vs. speed trade-off
- Recommend start with SVG and if too slow then move to WebGL
Tips and tricks
- Lots of complex polygons? Use rmapshaper to simplify, this can really speed up a slow map app
- App still slow? Use profvis to profile your script and find the bottleneck
- Have you reached the ‘cliff of complexity’? Check out Engineering production grade shiny apps
Leaflet example
Head over to Christina’s public github repo and clone to your local computer. This will give you access to all of the scripts and data you need to:
1. Build an interactive {leaflet} map: follow the R script ‘leaflet-map.R’
2. Turn the interactive {leaflet} map into a share-able and dynamic {shiny} web app: follow the R script ‘leaflet-app.R’
About the author


Christina is a quantitative ecologist at Griffith University interested in conserving blue forest ecosystems and informing climate-smart coastal restoration.